1 Introduction
atc2met, short for Air-Traffic-Control radio-communication to METeorological data, is a comprehensive system for observation, data processing, and data publication of meteorological data derived from the radio communication for air-traffic control based on the Secondary Surveillance Radar (SSR) Mode-S.
1.1 Current status of atc2met system
atc2met is still at development stage. Published data are for preliminary usage.
2 Measurement Techniques
SSR meteorological measurement technique is introduced by Vû et al. in 2018. Here, we briefly review on the procedure.
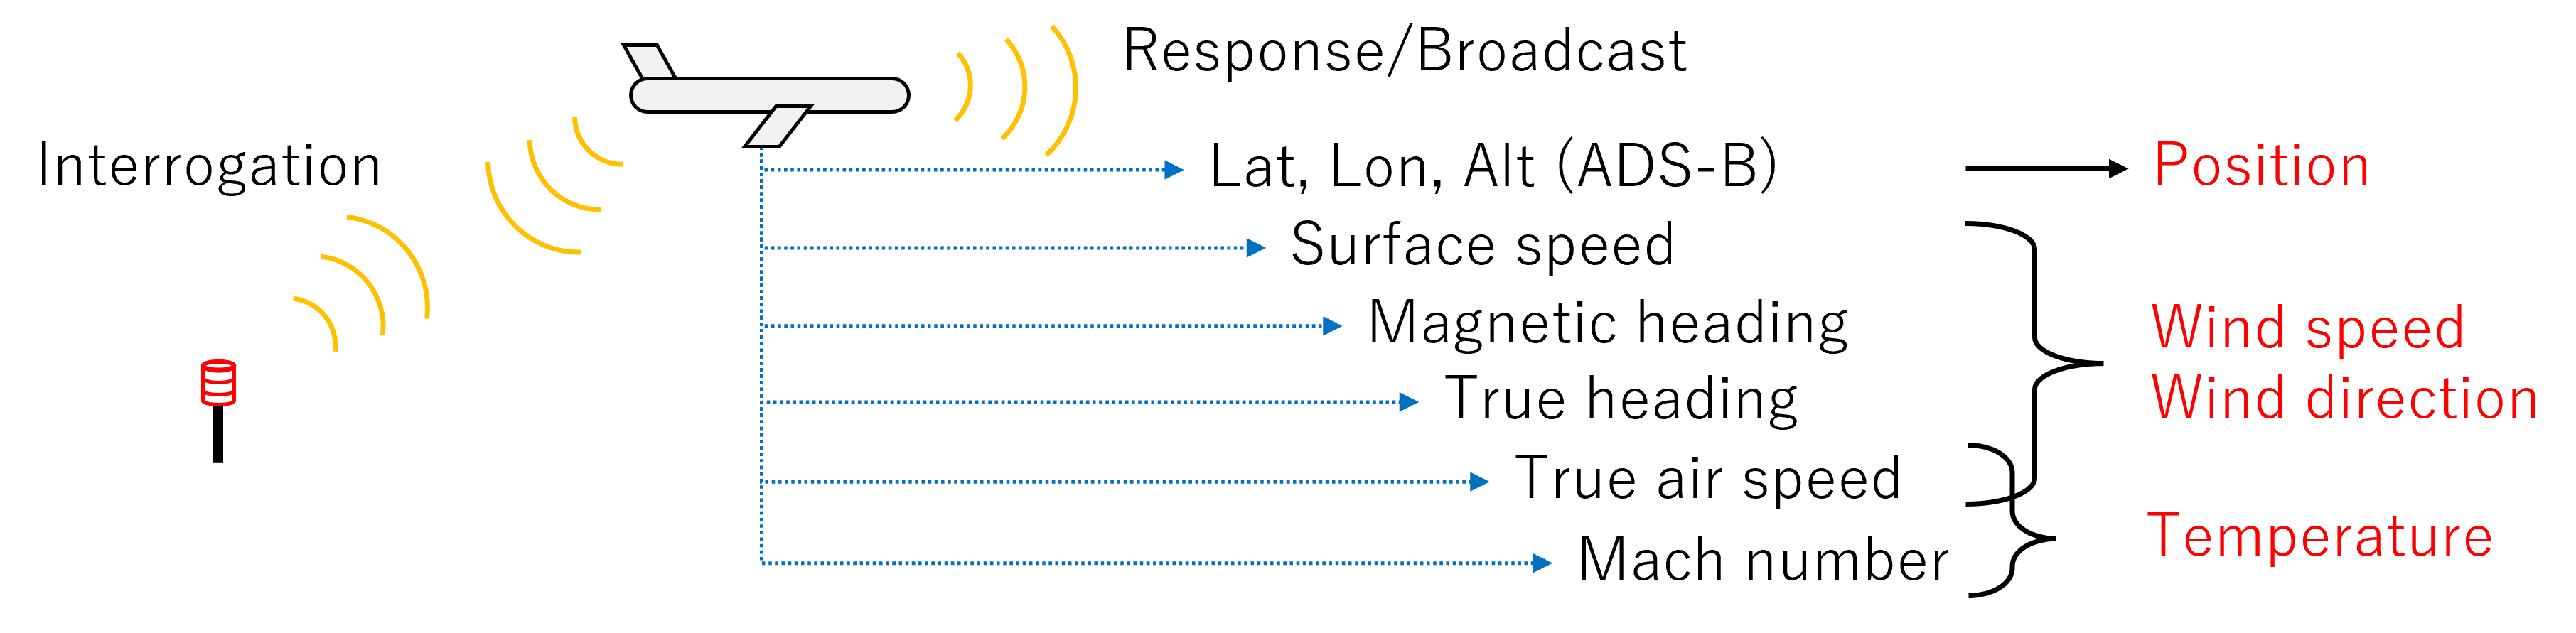
Commercial aircrafts measure information about the surrounding atmosphere for their navigation purpose. When an interrogation signal is transmitted from the ground station, corresponding response is transmitted in downlink format via SSR Mode-S. We can also receive these signals and reconstruct meteorological information around aircraft by applying appropriate inverse transformations.
Figure 1 describes the observable meteorological variables and corresponding messages in SSR Mode-S downlink format. Positions are obtained from Automatic Dependent Surveillance–Broadcast (ADS-B).
2.1 SSR Mode-S/ADS-B signal
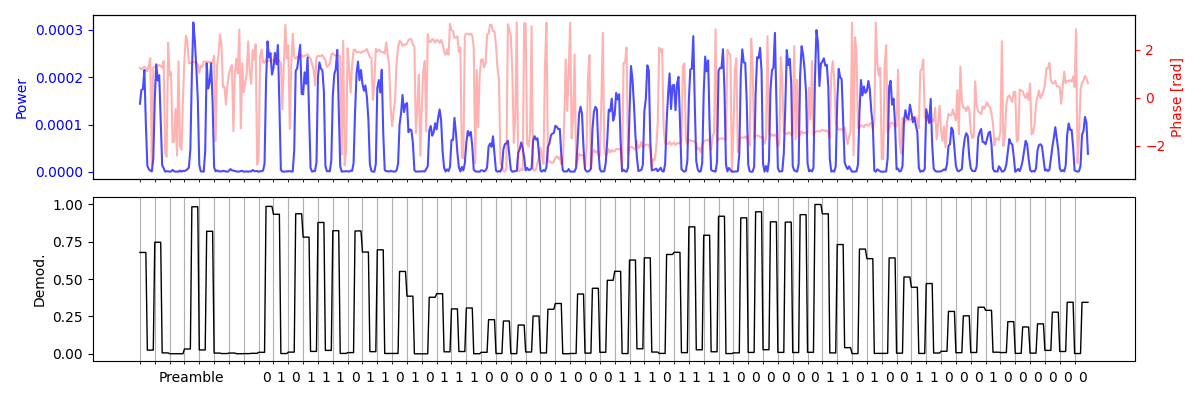
Secondary Surveillance Radar (SSR) Mode-S is a relatively new standard of a radio communication protocol used for the air traffic control. We overview the specifications of this protocol in Table 1. Note this table only refers to the reception; transmission for interrogation is on different frequency (1030 MHz). Figure 2 shows an example waveform and demodulated bits of SSR Mode-S signal DF = 11 (All-call Reply).
| Tx Frequency | |
| Tx Bandwidth | |
| Modulation | Pulse position modulation |
| Baud rate | |
| Rx Bandwidth |
2.1.1 Decoding procedure
SSR Mode-S and ADS-B uses the pulse position modulation at 1 Mbps baud rate. Hence, the minimum sampling rate for the receiver is 2 Mbps. Decoding procedure is as follows:
- Search the preamble (fixed pattern, first 8 us) to determin the start point of the data bits,
- Determin the pulse position for each successive microsecond bin. When a pulse is ahead or behind of the center of each 1us bin, 1 or 0 is assigned for each bit,
- Decode the downlink format (DF) from the first 2 or 5 bits as integers. The length of the data bits is also obtained according to the downlink format, as in Table 2,
- Try demodulate all bits. DF = 11 and 17 contains the identifier of the aircraft (ICAO Address,) which will be saved for the further processing.
- Check the validity of the message using the last 24 bits, which contains the Cyclic Redundancy Check (CRC) value of the other bits of data block. For DF other than 11 or 17, the CRC is XOR-ed with ICAO Address, so we need to try all known ICAO Address first by taking XOR again, because:
| DF | Bits |
|---|---|
| 0, 4, 11 | 56 |
| 17, 20, 21 | 112 |
2.1.2 Messages of our interest
Among various downlink format of SSR Mode-S and ADS-B, messages in Table 3 are particularly important for SSR meteorological measurement. Positions, wind field, and temperature are computed from these messages.
| DF | TC | BDS | Contents |
|---|---|---|---|
| 4/20 | Mode-S Surveillance (Altitude) | ||
| 11 | Mode-S all call reply (ICAO Address) | ||
| 17 | 1-4 | ADS-B Aircraft Identification (Call Sign) | |
| 17 | 5-8 | ADS-B Surface Position (Latitude, Longitude, Ground Speed) | |
| 17 | 9-18/20-22 | ADS-B Airborne position (Latitude, Longitude, Altitude) | |
| 17 | 19 | ADS-B Airborne velocity (Ground Speed / Indicated Air Speed / True Air Speed) | |
| 20/21 | 2,0 | Aircraft identification (Call sign) | |
| 20/21 | 5,0 | Track and turn report (Roll angle, track angle, track rate, ground speed, true air speed) | |
| 20/21 | 6,0 | Heading and speed report (Magnetic heading, Indicated air speed, Mach number, Vertical rates) | |
| 20/21 | 4,4 | Meteorological routine air report (wind, temperature, pressure, humidity, turbulence) | |
| 20/21 | 4,5 | Meteorological hazard report (turbulence, wind shear, Microburst, Icing, Wake vortex, temperature, pressure, radio height) |
2.2 Computation of the meteorological information
2.2.1 Positions
Positions are mainly computed from ADS-B messages (DF = 17).
2.2.2 Wind field
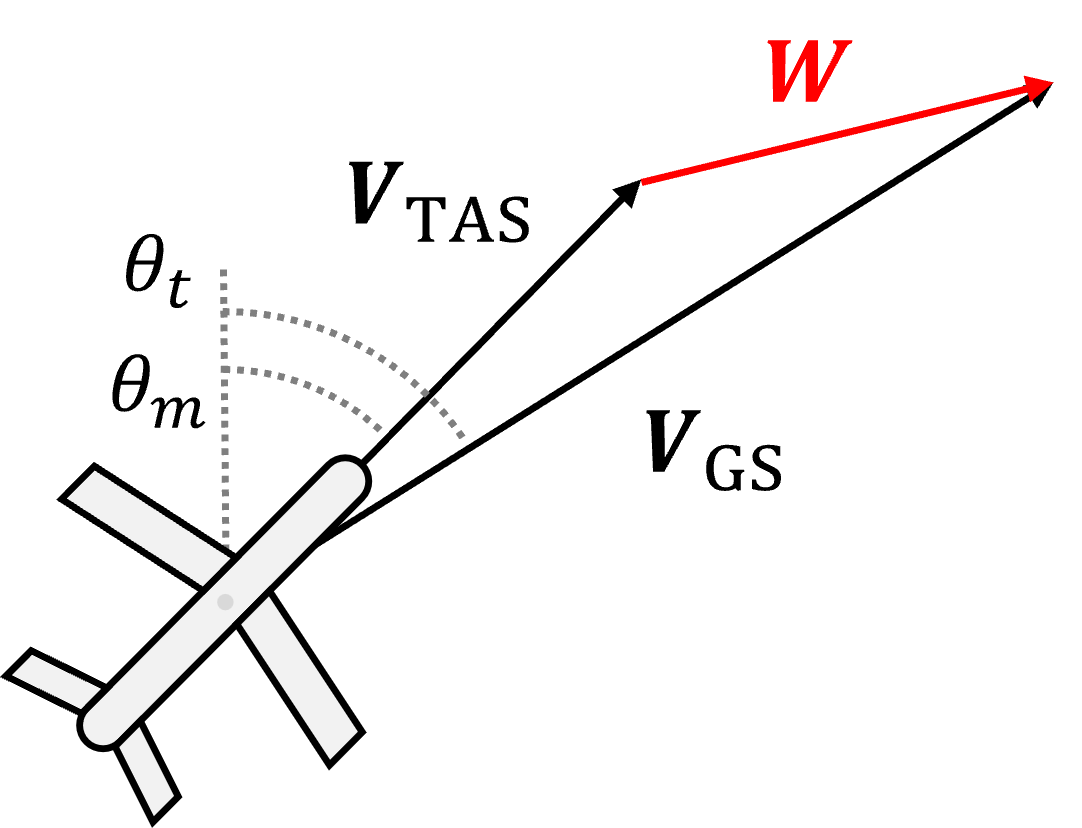
Wind fields are computed from vector difference between the ground velocity vector and true air velocity vector . The ground velocity vector is computed from the Ground Speed and True track angle . The true air velocity vector is computed from the True Air Speed and magnetic heading . The implementation corrects magnetic heading for geomagnetic declination before resolving the air-velocity vector in east and north components. Horizontal wind is ground velocity minus this air velocity. Figure 3 shows the relationships among these vectors.
2.2.3 Temperature
Temperature is estimated from true airspeed and Mach number . The ISA pressure relation provides the pressure-altitude context:
Here, , , and are the ISA layer constants as in Table 4, , , , , and are the ISA constants in Table 5, is the Mach number, is the estimated air pressure, is the estimated air density, and is the estimated temperature.
In this relation, is in kelvin and true airspeed and must use the same speed unit. It follows from the speed-of-sound relation described in Vû (2018), p. 8, Eq. 14 and Table IV and NASA’s Mach-number explanation.
The v2 implementation recomputes Mach with the pyModeS calibrated-airspeed-to-Mach conversion, using the reported IAS input and pressure altitude. It applies the squared true-airspeed/Mach relation for finite positive Mach and subtracts 273.15 to store temperature in degrees Celsius. There is no Mach-0.3 switch or separate density-based low-speed temperature formula in that implementation. The density identity above is not used as an independent inversion for temperature.
| Layer | ||||
|---|---|---|---|---|
| Troposphere | 0 | 288.15 | 101325 | -6.5 |
| Tropopause | 11000 | 216.65 | 22632 | 0.0 |
| Stratosphere | 20000 | 216.65 | 5475 | 1.0 |
| Symbol | Description | Value |
|---|---|---|
| speed of sound at sea level | 340.3 m s-1 | |
| Gravitational acceleration | 9.81 m s | |
| Air pressure at sea level | 101325 Pa | |
| Specific gas constant for dry air | 287.05 J kg K | |
| Temperature at sea level |
3 Implementation of SSR meteorological measurement
3.1 atc2met system
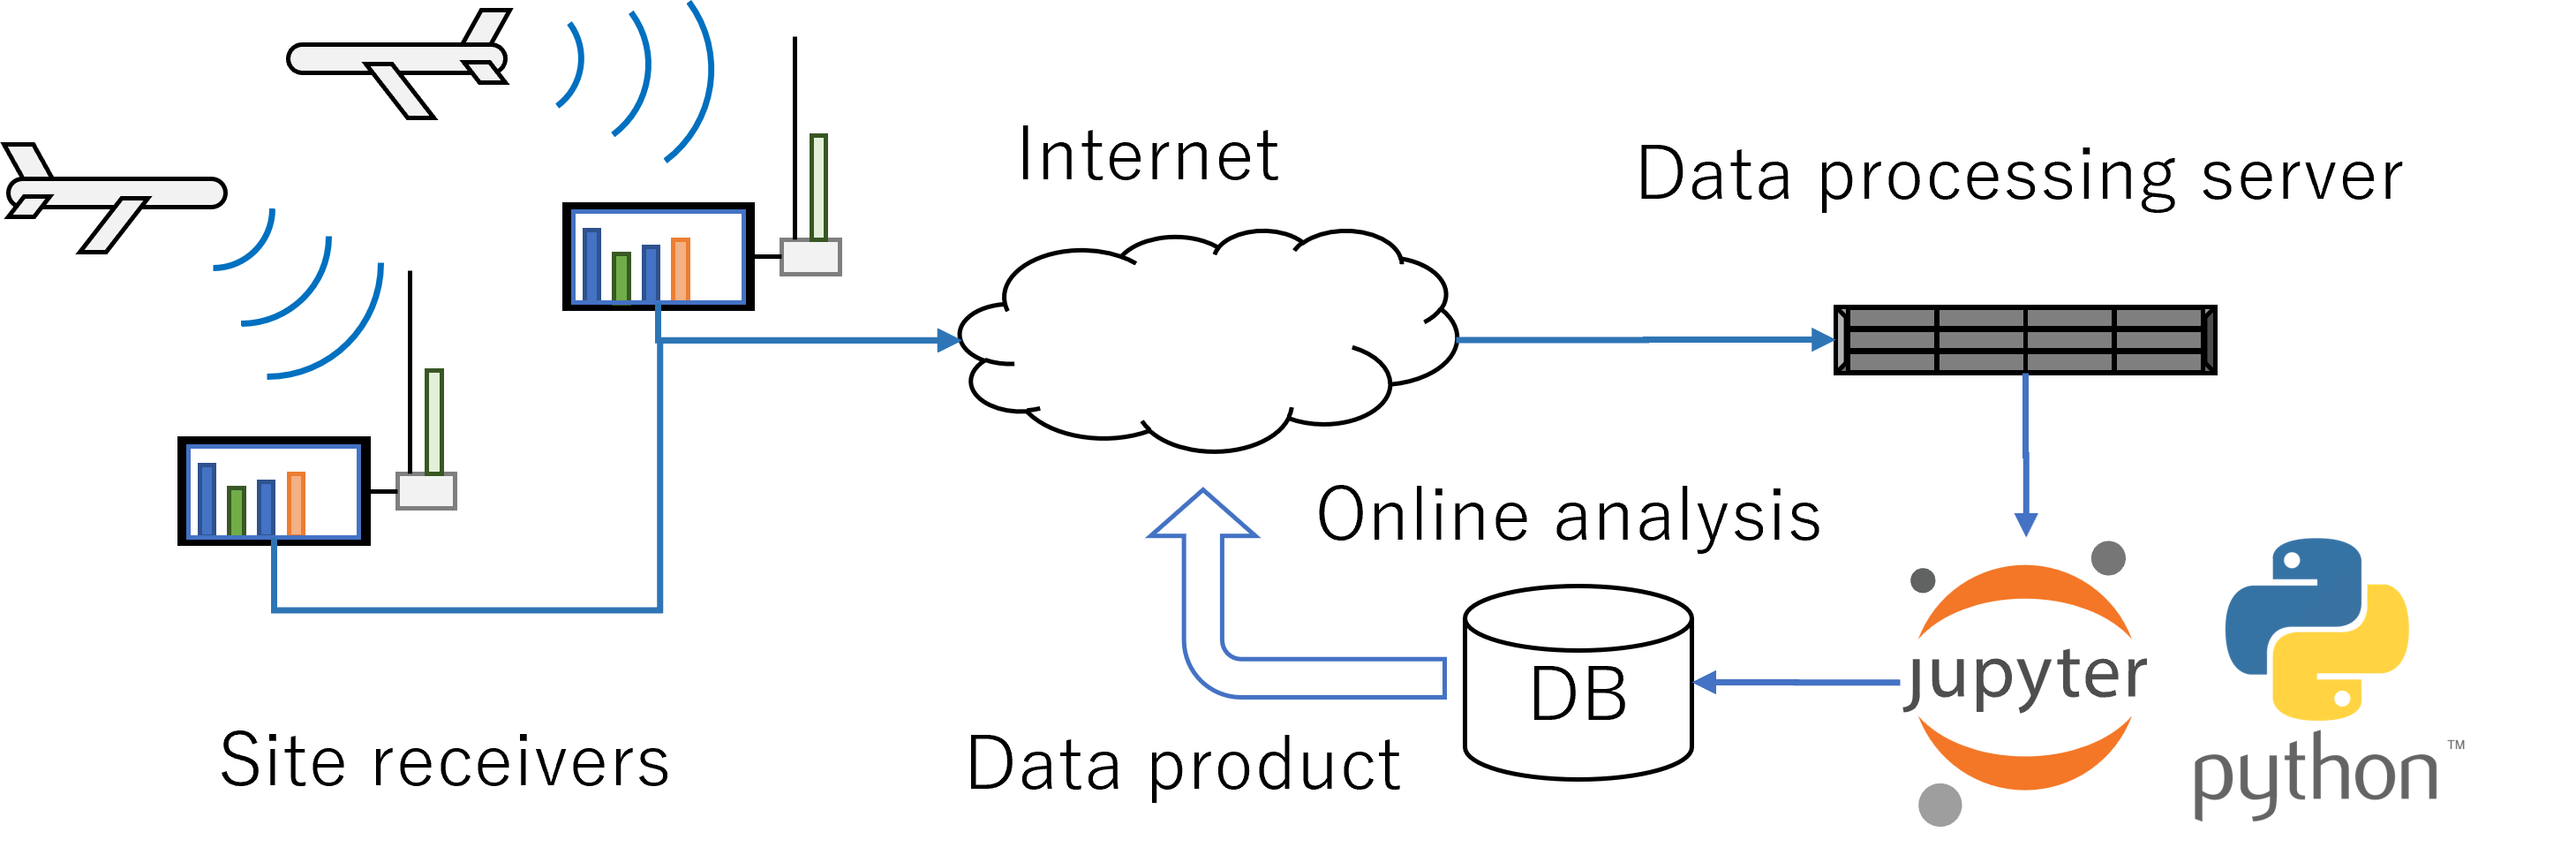
atc2met system is composed of site receivers and data processing server connected via Internet. Figure 4 shows the whole structure of the atc2met system. Site receivers receives the SSR Mode-S/ADS-B signal from commercial aircrafts and send decoded messages to the central data processing server. The message is further processed and meteorological data are reconstructed. An automatic quality control procedure is also running on the server. Data products are then published at https://atc2met.nipr.ac.jp.
3.2 Site receiver
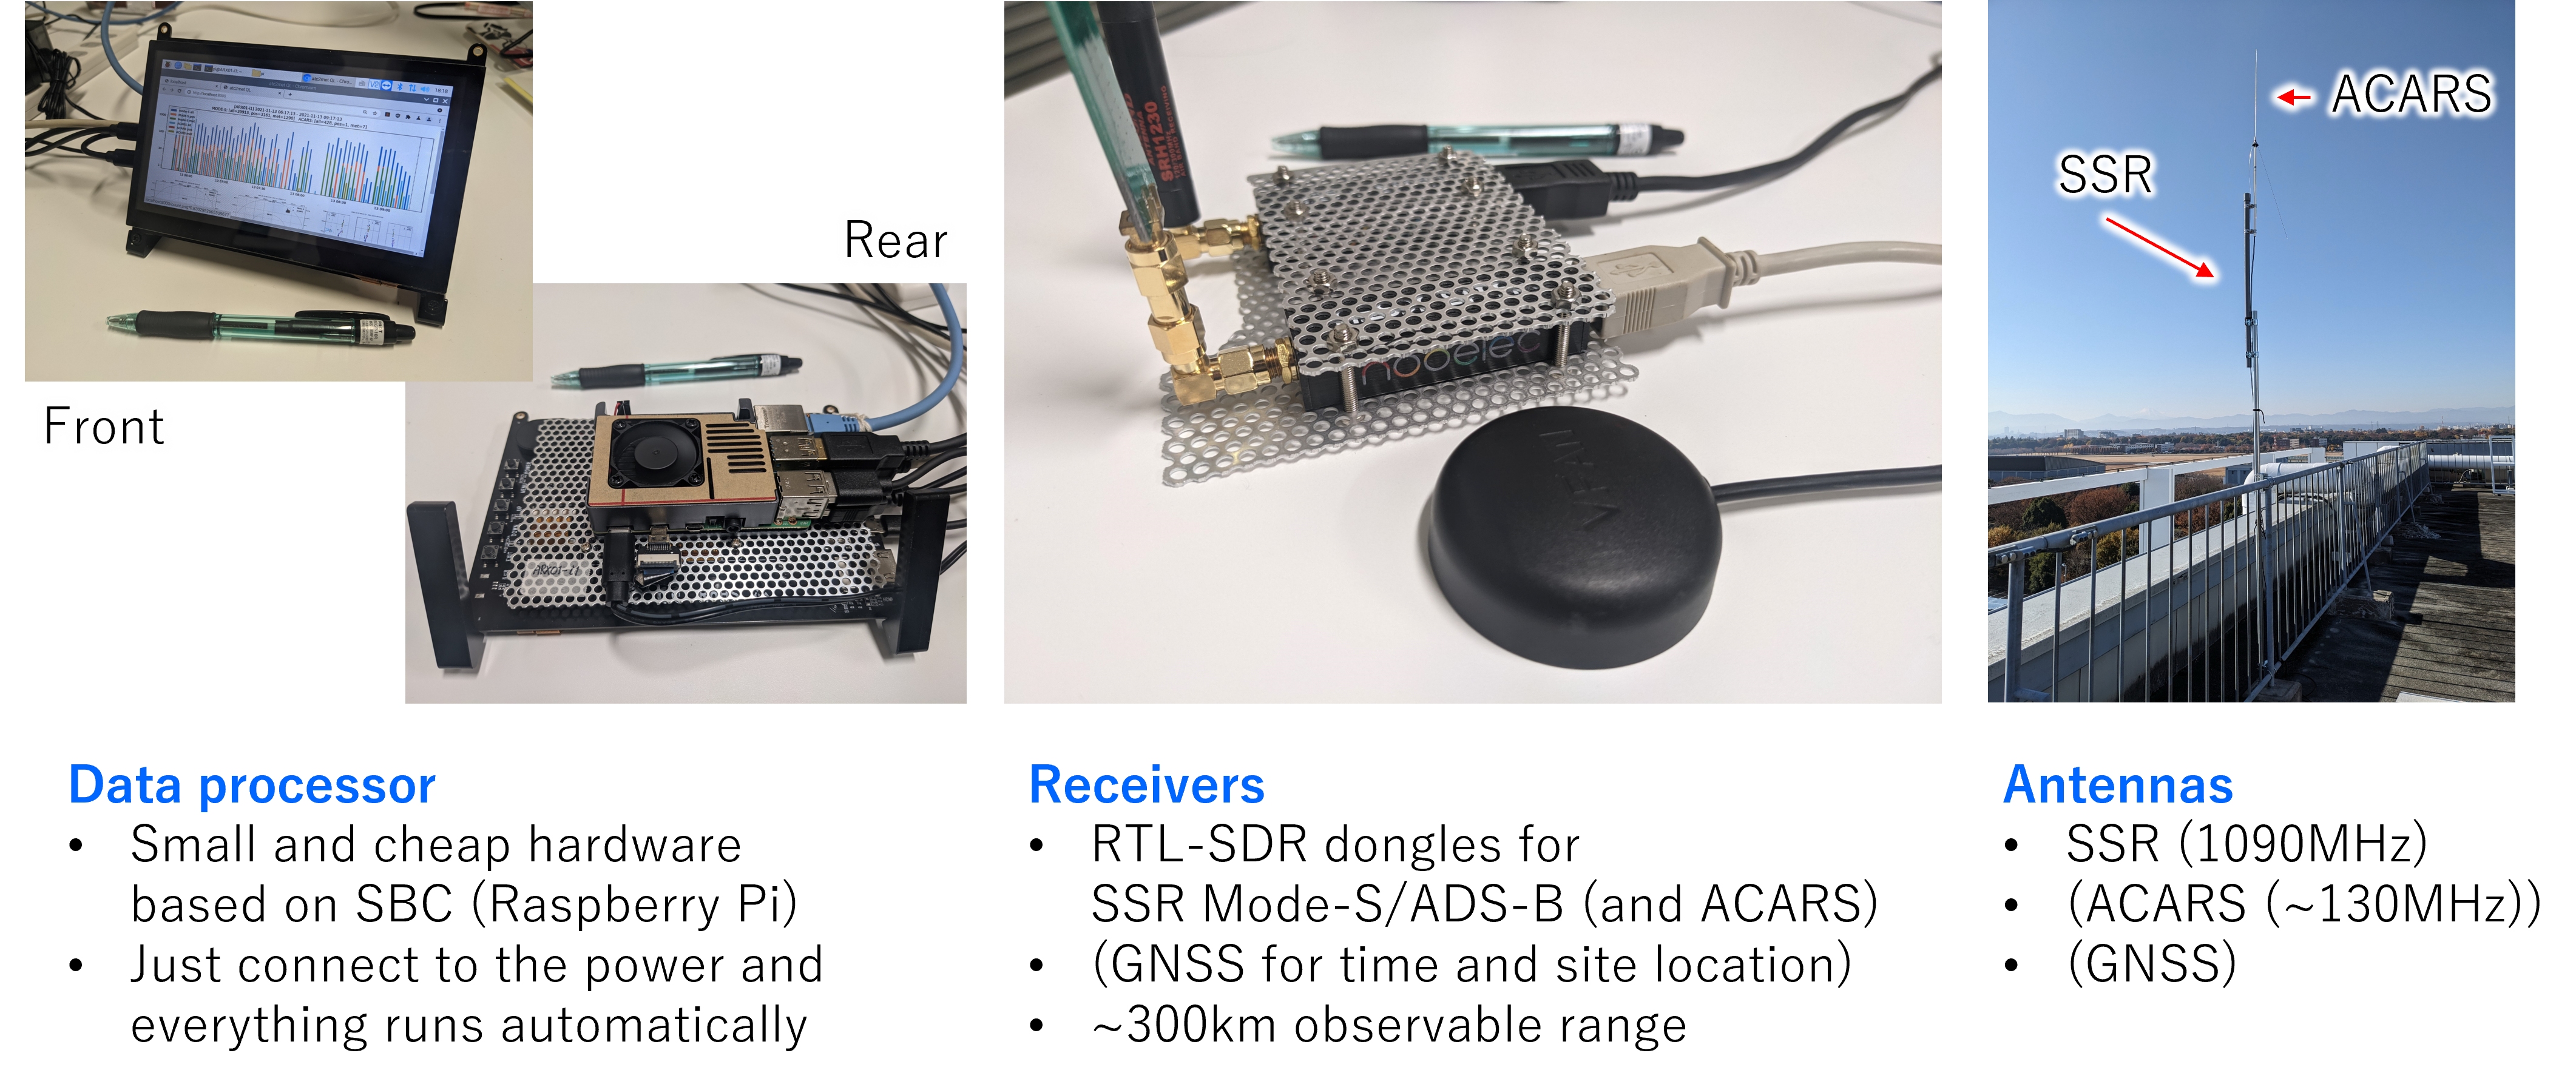
Site receiver is designed to be small and inexpensive, aiming for easy deployment at multiple locations. The data processor is based on a single board computer (e.g., Raspberry Pi 4). Radio frequency receiver is based on the software-defined radio (SDR) architecture, supporting RTL-SDR based DVB-T dongle for digital television, HackRF One, USRP. Antennas can also be small ( frequency wavelength), like printed circuit board (PCB) type antenna. The maximum coverage of each site receiver depends on the line of sight, but roughly 300 km. Figure 5 shows each component of a site receiver.
For the demodulator/decoder software, you can use, for example, the famous dump1090 software to receive SSR Mode-S signal on a RTL-SDR platform.
For HackRF or USRP, we have been developing a receiver software ssrx on GitHub.
3.3 Data processing
Data from site receivers are gathered to the analysis server and published after appropriate quality control and some basic analysis.
3.3.1 Quality Control
Aircraft trajectories are smoothed before wind and temperature are reconstructed. The current processing steps and acceptance guidance are described in Processing pipeline and Quality and limitations.
3.3.2 Data products
Data products of atc2met contains:
- Air temperature,
- Wind speed/direction,
Observable heights are roughly 0 - 12 km. Table 6 shows the resolutions of the data products.
| Resolution | V2 native H3 | V2 regular-grid view |
|---|---|---|
| Time | 10 min | 10 min |
| Horizontal | H3 resolution 5 | Nominal 20 km |
| Vertical | 0.25 km pressure altitude | 0.25 km pressure altitude |
4 Details on provided data products
4.1 Site locations
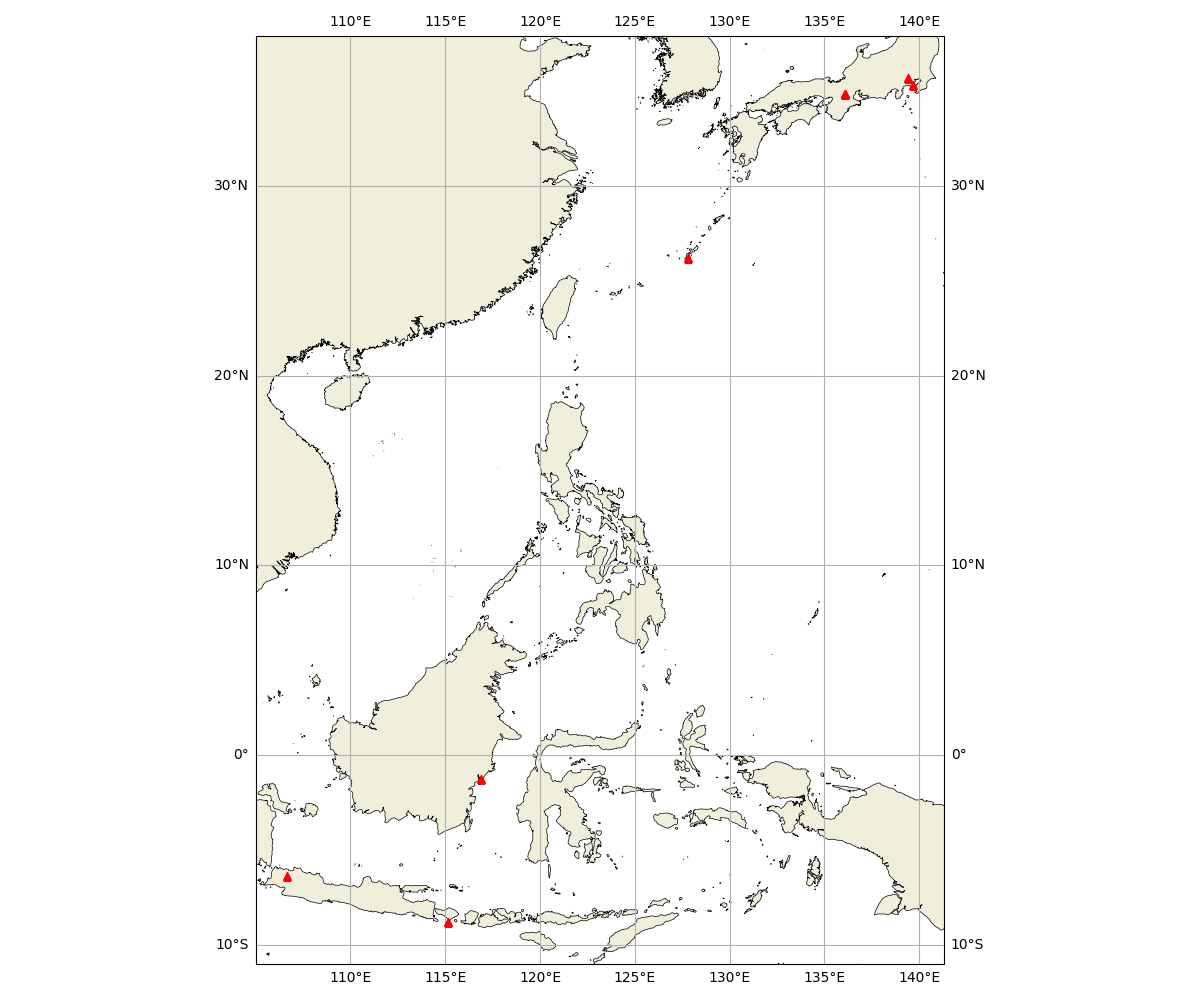
There are currently four sites in Japan, and 3 sites in Indonesia.
4.1.1 Japan
- NIPR, Tokyo
- JAMSTEC, Kanagawa
- Shigaraki MU observatory, Shiga
- Ryukyu University, Okinawa
4.1.2 Indonesia
- Jakarta
- Denpasar
- Balikpapan
4.2 Data format
Migrating from V1 / V1.1 to V2
V2 is a new analysis and product schema. Changing the version in a filename is not enough to migrate an existing reader or reproduce earlier values.
| Earlier products | V2 and required reader changes |
|---|---|
height vertical dimension | Use pressure_altitude and its units/bounds. This is pressure altitude, not geometric height; do not infer an altitude conversion from a rename alone. |
| V1 percentile variables | Percentiles are not provided in V2. Standard deviations (U_std, V_std, T_std) describe within-bin spread and are not percentile replacements. |
| V1 profile or V1.1 latitude/longitude grid | The canonical V2 file uses H3 cells. A separate regular-grid NetCDF is available for latitude/longitude workflows, but it still has the V2 schema and processing. |
| Earlier sample counts and quality rules | V2 trajectory reconstruction and acceptance criteria can change counts, values and availability. Use UV_n, T_n, aircraft_n, fill values and time/altitude bounds; zero accepted count is not a zero wind or temperature measurement. |
Inspect each file's dimensions, units, coordinates, product_version and processing metadata before combining versions. Keep the original files and version labels for reproducibility.
Historical days without V2
The 23 October 2026 inventory comparison found 65 legacy site-days without V2. One was regenerated; 64 remain unavailable: 50 need receiver-location provenance, 6 have unavailable raw files, 2 have malformed raw input, and 6 yield no accepted V2 weather samples. These are reasoned non-generation records, not fabricated observations or proof that the old products were empty.
View all 64 dates, reasons and retained legacy downloads. Published V1/V1.1 references remain available under their original URLs; their processing and quality criteria differ from V2.
Existing links and figures
V1/V1.1 daily generation ended on 30 October 2026; V2 generation continues daily. The legacy daily index, dated /data/?date=YYYY-MM-DD links, original /api/product/… file URLs and legacy About guide remain available. V2 figures have direct PNG download links on Download and Coverage. Original About section anchors are also retained in this guide.
This website provides v2 and later data products.
V2 DOCUMENTATION · RESEARCH PRODUCT
Daily wind, temperature, counts and processing metadata.
A concise guide to what v2 contains, how it is produced, and what to check before using it in research.
4.2.1 Overview
v2 is a daily, boundary-aware analysis of Mode-S EHS and ADS-B observations. Aircraft trajectories are smoothed before wind and temperature are reconstructed. Accepted samples are aggregated into 10-minute time bins, 0.25 km pressure-altitude bins and H3 resolution-5 cells.
| PERIOD | TIME | VERTICAL | HORIZONTAL |
|---|---|---|---|
| 00:00–24:00 UTC | 10 minutes | 0.25 km | H3 resolution 5 |
4.2.2 Processing pipeline
Decode
Read Mode-S and ADS-B events for the target UTC day plus ten-minute boundary context.
Reconstruct trajectories
Split aircraft tracks at long gaps and apply forward and backward state smoothing.
Retrieve weather
Combine ground velocity, heading, true airspeed, Mach and pressure altitude to estimate horizontal wind and temperature.
Aggregate
Crop to the target day, apply acceptance limits, assign H3 cells and produce both native and regular-grid views.
4.2.3 Product files
H3 NetCDF (CANONICAL)
YYYYMMDD_SITE_h3.nc
Native sparse representation indexed by H3 cell, time and pressure altitude. Recommended for new analysis.
Regular-grid NetCDF (COMPATIBILITY)
YYYYMMDD_SITE.nc
A conventional latitude–longitude view with nominal 20 km spacing, generated from the same accepted samples.
Native web views (INTERACTIVE)
overview · inspector · coverage
Browser-rendered H3 coverage, time–height evolution and altitude-layer views generated directly from the canonical product.
The two downloadable formats below are NetCDF-4 files with HDF5 storage. These header-equivalent listings contain the actual dimensions, variable types and attributes of one published site-day in each format. Data arrays and internal source/configuration metadata are excluded; the listings are not verbatim ncdump output.
Only attributes present in the sampled files are listed. In these examples, U, V and T do not declare a units attribute. The H3 pressure_altitude coordinate also omits it, while pressure_altitude_bounds declares km. The physical units in Core variables describe the quantities and are not added to the header examples.
H3 NetCDF-4 header example
Source: 20261012_0163fe6c7d7ea1ea_h3.nc. SHA-256: 5fc1a89b65499278c46626b9fe98aec3f76749768c6eac0173dc08c4a7a27b6d.
// Format: NETCDF4; storage: HDF5
netcdf 20261012_0163fe6c7d7ea1ea_h3 {
dimensions:
    time = 144 ;
    h3_cell = 866 ;
    pressure_altitude = 48 ;
    bounds = 2 ;
    vertex = 6 ;
variables:
    int64 time(time) ;
        time:units = "minutes since 2026-10-12 00:00:00" ;
        time:calendar = "proleptic_gregorian" ;
    string h3_cell(h3_cell) ;
    double pressure_altitude(pressure_altitude) ;
        pressure_altitude:_FillValue = NaN ;
    int UV_n(time, h3_cell, pressure_altitude) ;
        UV_n:long_name = "count for zonal/meridional winds" ;
        UV_n:coordinates = "latitude longitude" ;
    float U(time, h3_cell, pressure_altitude) ;
        U:_FillValue = NaN ;
        U:long_name = "zonal wind" ;
        U:coordinates = "latitude longitude" ;
    float U_std(time, h3_cell, pressure_altitude) ;
        U_std:_FillValue = NaN ;
        U_std:long_name = "standard deviation of zonal wind" ;
        U_std:coordinates = "latitude longitude" ;
    float V(time, h3_cell, pressure_altitude) ;
        V:_FillValue = NaN ;
        V:long_name = "meridional wind" ;
        V:coordinates = "latitude longitude" ;
    float V_std(time, h3_cell, pressure_altitude) ;
        V_std:_FillValue = NaN ;
        V_std:long_name = "standard deviation of meridional wind" ;
        V_std:coordinates = "latitude longitude" ;
    int T_n(time, h3_cell, pressure_altitude) ;
        T_n:long_name = "count for temperature" ;
        T_n:coordinates = "latitude longitude" ;
    float T(time, h3_cell, pressure_altitude) ;
        T:_FillValue = NaN ;
        T:long_name = "temperature" ;
        T:coordinates = "latitude longitude" ;
    float T_std(time, h3_cell, pressure_altitude) ;
        T_std:_FillValue = NaN ;
        T_std:long_name = "standard deviation of temperature" ;
        T_std:coordinates = "latitude longitude" ;
    short aircraft_n(time, h3_cell, pressure_altitude) ;
        aircraft_n:long_name = "number of unique aircraft" ;
        aircraft_n:coordinates = "latitude longitude" ;
    double pressure_altitude_bounds(pressure_altitude, bounds) ;
        pressure_altitude_bounds:_FillValue = NaN ;
        pressure_altitude_bounds:units = "km" ;
    double h3_cell_latitude_bounds(h3_cell, vertex) ;
        h3_cell_latitude_bounds:_FillValue = NaN ;
        h3_cell_latitude_bounds:coordinates = "latitude longitude" ;
    double h3_cell_longitude_bounds(h3_cell, vertex) ;
        h3_cell_longitude_bounds:_FillValue = NaN ;
        h3_cell_longitude_bounds:coordinates = "latitude longitude" ;
    double latitude(h3_cell) ;
        latitude:_FillValue = NaN ;
        latitude:units = "degrees_north" ;
        latitude:long_name = "H3 cell center latitude" ;
    double longitude(h3_cell) ;
        longitude:_FillValue = NaN ;
        longitude:units = "degrees_east" ;
        longitude:long_name = "H3 cell center longitude" ;
// selected global attributes:
    :product_version = "v2" ;
    :analysis_version = "v2" ;
    :tres_min = 10 ;
    :vres_km = 0.25 ;
    :hmax_km = 300 ;
    :vmax_km = 12 ;
    :weather_sample_count = 132292 ;
    :horizontal_grid = "H3" ;
    :h3_resolution = 5 ;
    :h3_average_hexagon_area_km2 = 252.9038581819449 ;
    :h3_average_hexagon_edge_km = 9.85409099 ;
    :date = "2026-10-12" ;
    :site_id = "0163fe6c7d7ea1ea" ;
    :site_name = "0163fe6c7d7ea1ea" ;
    :latitude = 35.7047 ;
    :longitude = 139.419 ;
    :site_latitude = 35.7047 ;
    :site_longitude = 139.419 ;
    :software_version = "0.7.1" ;
    :created_at = "2026-10-15T08:33:44.816480" ;
    :analysis_context_minutes = 10 ;
    :trajectory_count = 3117 ;
}
Latitude/longitude NetCDF-4 header example
Source: 20261012_0163fe6c7d7ea1ea.nc. SHA-256: cee483afce6a7470e87988cb8f76aaae6377b83e1e0f5e934227c568a88e6fe1.
// Format: NETCDF4; storage: HDF5
netcdf 20261012_0163fe6c7d7ea1ea {
dimensions:
    time = 144 ;
    latitude = 30 ;
    longitude = 30 ;
    pressure_altitude = 48 ;
    bounds = 2 ;
variables:
    int64 time(time) ;
        time:units = "minutes since 2026-10-12 00:00:00" ;
        time:calendar = "proleptic_gregorian" ;
    double latitude(latitude) ;
        latitude:_FillValue = NaN ;
        latitude:units = "degrees_north" ;
        latitude:bounds = "latitude_bounds" ;
    double longitude(longitude) ;
        longitude:_FillValue = NaN ;
        longitude:units = "degrees_east" ;
        longitude:bounds = "longitude_bounds" ;
    double pressure_altitude(pressure_altitude) ;
        pressure_altitude:_FillValue = NaN ;
        pressure_altitude:units = "km" ;
        pressure_altitude:positive = "up" ;
        pressure_altitude:long_name = "barometric pressure altitude" ;
        pressure_altitude:bounds = "pressure_altitude_bounds" ;
    int UV_n(time, latitude, longitude, pressure_altitude) ;
        UV_n:long_name = "count for zonal/meridional winds" ;
    float U(time, latitude, longitude, pressure_altitude) ;
        U:_FillValue = NaN ;
        U:long_name = "zonal wind" ;
    float U_std(time, latitude, longitude, pressure_altitude) ;
        U_std:_FillValue = NaN ;
        U_std:long_name = "standard deviation of zonal wind" ;
    float V(time, latitude, longitude, pressure_altitude) ;
        V:_FillValue = NaN ;
        V:long_name = "meridional wind" ;
    float V_std(time, latitude, longitude, pressure_altitude) ;
        V_std:_FillValue = NaN ;
        V_std:long_name = "standard deviation of meridional wind" ;
    int T_n(time, latitude, longitude, pressure_altitude) ;
        T_n:long_name = "count for temperature" ;
    float T(time, latitude, longitude, pressure_altitude) ;
        T:_FillValue = NaN ;
        T:long_name = "temperature" ;
    float T_std(time, latitude, longitude, pressure_altitude) ;
        T_std:_FillValue = NaN ;
        T_std:long_name = "standard deviation of temperature" ;
    short aircraft_n(time, latitude, longitude, pressure_altitude) ;
        aircraft_n:long_name = "number of unique aircraft" ;
    double pressure_altitude_bounds(pressure_altitude, bounds) ;
        pressure_altitude_bounds:_FillValue = NaN ;
    double latitude_bounds(latitude, bounds) ;
        latitude_bounds:_FillValue = NaN ;
    double longitude_bounds(longitude, bounds) ;
        longitude_bounds:_FillValue = NaN ;
// selected global attributes:
    :product_version = "v2" ;
    :analysis_version = "v2" ;
    :tres_min = 10 ;
    :vres_km = 0.25 ;
    :hmax_km = 300 ;
    :vmax_km = 12 ;
    :weather_sample_count = 132292 ;
    :horizontal_grid = "regular latitude/longitude view" ;
    :hres_km = 20 ;
    :date = "2026-10-12" ;
    :site_id = "0163fe6c7d7ea1ea" ;
    :site_name = "0163fe6c7d7ea1ea" ;
    :latitude = 35.7047 ;
    :longitude = 139.419 ;
    :site_latitude = 35.7047 ;
    :site_longitude = 139.419 ;
    :software_version = "0.7.1" ;
    :created_at = "2026-10-15T08:33:44.816480" ;
    :analysis_context_minutes = 10 ;
    :trajectory_count = 3117 ;
}
4.2.4 Core variables
| VARIABLE | MEANING | UNIT |
|---|---|---|
U |
Zonal wind | m s⁻¹ |
V |
Meridional wind | m s⁻¹ |
T |
Air temperature | °C |
UV_n |
Number of retained samples with both finite U and V in this native bin | count |
T_n |
Number of retained samples with finite temperature in this native bin | count |
U_std / V_std |
Sample standard deviation of U or V within the native bin | m s⁻¹ |
T_std |
Sample standard deviation of temperature within the native bin | °C |
aircraft_n |
Distinct ICAO identifiers within one native time × horizontal cell × pressure-altitude bin | count |
time |
Start of the native 10-minute UTC bin | minutes since the file’s UTC midnight |
pressure_altitude |
Centre of a barometric pressure-altitude bin | km |
pressure_altitude_bounds |
Lower and upper edges of that bin | km |
Time coordinates and bin edges. The 144 native time values are 0, 10, 20, …, 1430 minutes from the midnight named in the file’s time:units attribute. The label is the start, not the centre or end, of a half-open interval: 00:10 represents [00:10, 00:20) UTC. A sample at 00:20 belongs to the next bin. The last bin is [23:50, 24:00); 24:00 is midnight on the next UTC date. Boundary context helps retrieval near midnight, but only samples inside the target UTC date enter its product.
Pressure altitude. The vertical coordinate is barometric pressure altitude under the standard-atmosphere reference, not GNSS/geometric height or height above local terrain. The current native bins span 0–12 km in 0.25 km steps. Coordinates are bin centres, beginning at 0.125, 0.375 and 0.625 km; bounds begin [0, 0.25), [0.25, 0.5) and [0.5, 0.75) km. Browser vertical exaggeration changes only the drawing. Read each file’s coordinates, bounds and vres_km for its actual vertical configuration.
Missing values and counts. A zero UV_n means no retained finite wind pair in that native bin, not calm wind; zero T_n means no retained finite temperature, not 0 °C. Means remain missing where their associated count is zero. A finite zero U, V or T with a positive count is a value, not a missing-data code. Standard deviations use sample statistics: a single-sample bin can have a mean while its standard deviation is missing. aircraft_n is a per-bin distinct-identifier count and need not equal either meteorological sample count. Missing bins or dates are not filled using another date or receiver.
Display aggregation and variability. The default 30-minute view combines three native time bins. U, V and temperature use their matching sample-count weights. Aircraft-bin and sample counts are summed across displayed bins; an aircraft present in several bins can contribute several times. These sums are not unique aircraft over the selected period or area. Within-bin wind variability uses the combined U/V standard-deviation magnitude, averaged with wind-sample weights for a longer display window. It is not a retrieval error estimate, standard error, confidence interval or a newly pooled standard deviation of all observations in that window.
The physical units above follow the retrieval and aggregation code. The real header examples remain literal to their sampled attributes: missing units attributes are not silently inserted into those examples or the downloadable files.
4.2.5 Quality and limitations
Temperature and wind have different error characteristics and should be evaluated independently. Missing cells remain missing; the products do not interpolate a complete atmospheric analysis.
Quick look defaults to 30-minute display windows. Wind, temperature and within-bin variability are weighted by their sample counts, while aircraft-bin and sample counts are summed from native bins. Aircraft-bin values are shown as exact integers rather than being grouped into an upper category. Display acceptance filters and colour limits do not rewrite the NetCDF data or provide a formal uncertainty flag; inspect values, counts and variability in the files for research use.
Wind uses separate U and V time-height and vertical-profile views, alongside one H3 map where color represents wind speed and arrow angle and length represent direction and relative speed. U and V share a symmetric, zero-centred scale: positive U is eastward and positive V is northward.
4.2.6 Citation and contact
A versioned data citation and license are being prepared. Until then, contact the atc2met project before using the product in a publication, and record the file name, product version, software version and creation time.
5 Credits
5.1 Acknowledgements
atc2met project is carried out by:
- MORI, Shuichi from Japan Agency for Marine-Earth Science and Technology (JAMSTEC),
- HASHIMOTO, Taishi from National Institute of Polar Research (NIPR), and
- MUSHIAKE, Kazuhiko from Ilohas Project Co., Ltd.
In collaboration with:
- KOGA, Tadashi and YOSHIHARA, Takayuki from Electronic Navigation Research Institute (ENRI)
The project is supported by:
- JSPS KAKENHI Grant-in-Aid for Challenging Research (Exploratory) (Grant Number JP20K21852),
- JSPS KAKENHI Grant-in-Aid for Scientific Research (B) (Grant Number 25K03255),
- Sumitomo Foundation Fiscal 2022 Grant For Environmental Research Projects (Grant Number 2230208), and
- Strategic Research Projects grant from ROIS (Research Organization of Information and Systems) (Project Number 2022-SRP-05).
5.2 Contact
If you want to use data provided here, please let me know so that I can provide more information about the data product.
5.2.1 橋本 大志 (Taishi Hashimoto)
hashimoto.taishi[at]nipr.ac.jp (replace [at] to @)
6 References
- Vû et al., ADS-B and Mode S Data for Aviation Meteorology and Aircraft Performance Modelling, 2018.
- Sun, Junzi, The 1090 Megahertz Riddle: A Guide to Decoding Mode S and ADS-B Signals, TU Delft OPEN Publishing, 2021, doi:https://doi.org/10.34641/mg.11.
- junzis/pyModeS, https://github.com/junzis/pyModeS.
- antirez/dump1090, GitHub, https://github.com/antirez/dump1090.